

It didnt make sense. It just didnt. How could the reliability be so low? Chad scratched his
Question:
It didn't make sense. It just didn't. How could the reliability be so low? Chad scratched his head and thought. Chad had agreed to help analyze the data from his graduate advisor's most recent study. Although entering the data into a computer database had not been exciting, it had been relatively easy. Once he had entered each research participant's responses, he spot-checked a few cases to ensure accuracy. He then conducted frequency analyses on each variable to ensure that there were no out-of-bounds responders. In fact, he'd found two cases in which he had incorrectly entered the data. He could tell, because items that were responded to on a five-point Likert-type rating scale had reported scores of 12 and 35, respectively. Sure enough, he'd just made a typo when entering the data. Everything else looked fine. Or so he thought, until he decided to examine the reliability of one of the scales. Chad's advisor, Dr. John Colman, was primarily interested in troubled adolescents, and over the last several years had investigated adolescent attitudes toward alcoholic beverages. The same measure of adolescent attitudes toward alcohol was routinely used in this research. Respondents indicated on a scale of 1-5 how strongly they agreed with each of the 12 items. Internal consistency reliability estimates for the scale were consistently good, typically around .80. However, not this time, apparently. In computing the reliability estimate for the data he'd just entered, Chad found that alpha was estimated to be -.39. Chad couldn't remember ever hearing of a negative internal consistency reliability estimate. In addition, he couldn't explain why the scale would have such a different reliability on this sample than it had with the many samples his advisor had previously used. His first thought was that he might have entered the data incorrectly-but he knew he hadn't. After all, he'd checked the data carefully to ensure that the computer data file matched exactly what was on the original surveys. So what could be the problem? In examining the item-total correlations for each item on the scale, Chad noticed that several items correlated negatively with a composite of the remaining items. Chad grabbed the original survey and reexamined the 12 items that comprised the adolescent attitudes toward alcohol scale. Each item certainly seemed to measure the intended construct. Chad was about to give up and go report the problem to his advisor when he noticed something. Although each of the 12 items measured attitudes toward alcohol, agreement to eight of the items would be indicative of acceptance of alcohol use. In contrast, agreement to the other four items would be indicative of a rejection of alcohol use. That was it. He'd correctly entered the data from the surveys into the computer data file, but had forgotten to recode the reverse-coded items. Because his advisor wanted high scores to be indicative of an acceptance of the use of alcohol, Chad decided he'd recode the four reverse-coded items. To do this, he used the recode command of his statistics program to recode all responses of "5" into "1," "4" into "2," "2" into "4," and "1" into "5." He did this for each of the four reverse-coded items. Holding his breath, he again computed the alpha. This time, the reliability estimate was α = .79, and all of the item-total correlations were positive. Satisfied that he'd been able to resolve the problem on his own, Chad made a mental note to always recode the appropriate items once the entire data file had been completed.
Questions
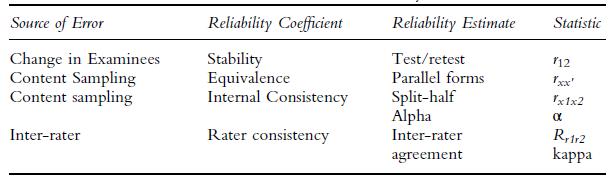
1. In terms of Table 6.1, what type of reliability coefficient did Chad estimate? What source of error is being estimated?
2. Did Chad make the right interpretation of his negative reliability estimate? What else might cause a negative reliability estimate?
3. In practice, how does one know which items to recode and which to keep the same?
4. Both positively and negatively worded items are frequently included on tests. Assuming you recode the negatively worded items before you run your reliability analysis, will the inclusion of negatively worded items affect the test’s internal consistency reliability estimate?
Table 6.1
Step by Step Answer:
1 Chad estimated a measure of internal consistency reliability most likely coefficient alpha The sou...View the full answer


Measurement Theory In Action
ISBN: 9780367192181
3rd Edition
Authors: Kenneth S Shultz, David Whitney, Michael J Zickar
