

Question: Using MATLAB, plot the response of a viscously damped spring-mass system subject to the rectangular pulse shown in Fig. 4.12 (a) with (a) (t_{0}=0.1 mathrm{~s})
Using MATLAB, plot the response of a viscously damped spring-mass system subject to the rectangular pulse shown in Fig. 4.12 (a) with (a) \(t_{0}=0.1 \mathrm{~s}\) and (b) \(t_{0}=1.5 \mathrm{~s}\). Assume the following data: \(m=100 \mathrm{~kg}, k=1200 \mathrm{~N} / \mathrm{m}, c=50 \mathrm{~N}-\mathrm{s} / \mathrm{m}, F_{0}=100 \mathrm{~N}\).
Figure 4.12(a):-
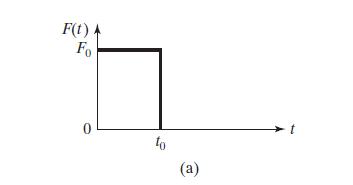
F(t) Fo to (a)
Step by Step Solution
★★★★★
3.47 Rating (157 Votes )
There are 3 Steps involved in it
1 Expert Approved Answer
Step: 1 Unlock

Question Has Been Solved by an Expert!
Get step-by-step solutions from verified subject matter experts
Step: 2 Unlock
Step: 3 Unlock