

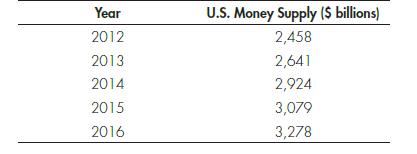
Represent the following data in bar graph form. Year U.S. Money Supply ($ billions) 2012 2,458 2013
Question:
Represent the following data in bar graph form.
Step by Step Answer:

This question has not been answered yet.
You can Ask your question!
Related Book For 

Question Posted:
