

The following graph shows the market for pollution rights. a. If there are no restrictions on pollution,
Question:
The following graph shows the market for pollution rights.
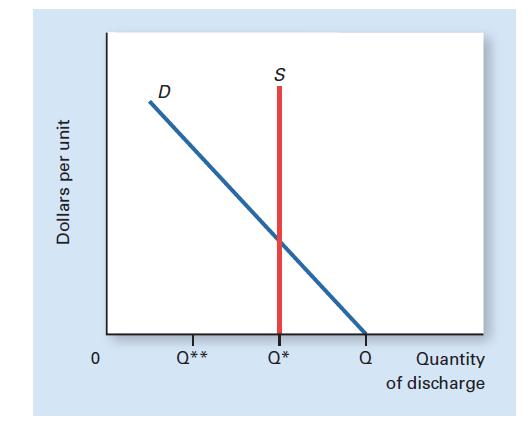
a. If there are no restrictions on pollution, what amount is discharged?
b. What is the quantity supplied and the quantity demanded if the government restricts the amount of discharge to Q* but gives the permits away?
c. Where is market equilibrium if the government sells the permits at the market-clearing price? Illustrate this on the graph.
d. What happens to market equilibrium if the government reduces the amount of discharge permitted to Q**? Illustrate this on the graph.
e. How could an environmental group ensure a lower rate of discharge than that chosen by public officials?
Step by Step Answer:

This question has not been answered yet.
You can Ask your question!
Related Book For 
Microeconomics A Contemporary Introduction
ISBN: 9781305505537
11th Edition
Authors: William A. McEachern
Question Posted:
