

Use Figure 13-6 to show what happens to the following when the marginal cost of diamond production
Question:
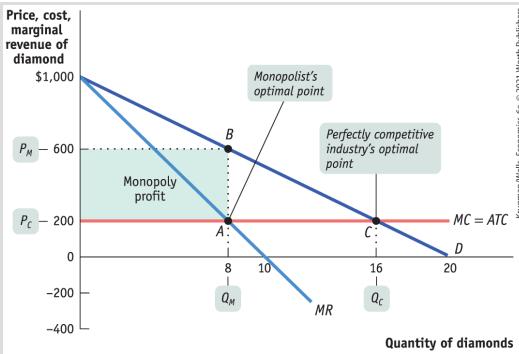
Use Figure 13-6 to show what happens to the following when the marginal cost of diamond production rises from $200 to $400.
Marginal cost curve Profit-maximizing price and quantity Profit of the monopolist Perfectly competitive industry profits
Figure 13-6:
Fantastic news! We've Found the answer you've been seeking!
Step by Step Answer:
As the accompanying diagram shows the marginal cost curve shifts upward to 400 The ...View the full answer

Answered By
Muhammad Rehan
Enjoy testing and can find bugs easily and help improve the product quality.
10+ Reviews
10+ Question Solved
Related Book For 

Question Posted:
