

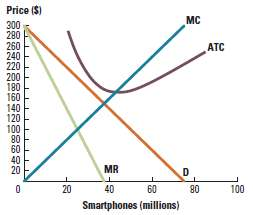
Figure 15P-2 shows the monopolistically competitive market for smartphones. a. Plot the profit-maximizing price and quantity on
Question:
a. Plot the profit-maximizing price and quantity on the graph. Is this producer earning positive or negative profits in the short run?
b. In the long run, will supply or demand for this producer's good be affected? Will economic profits increase or decrease for this producer?
Figure 15P-2:
Fantastic news! We've Found the answer you've been seeking!
Step by Step Answer:
a This producer is earning negative profits The producer is p...View the full answer

Answered By
Ali Khawaja
my expertise are as follows: financial accounting : - journal entries - financial statements including balance sheet, profit & loss account, cash flow statement & statement of changes in equity -consolidated statement of financial position. -ratio analysis -depreciation methods -accounting concepts -understanding and application of all international financial reporting standards (ifrs) -international accounting standards (ias) -etc business analysis : -business strategy -strategic choices -business processes -e-business -e-marketing -project management -finance -hrm financial management : -project appraisal -capital budgeting -net present value (npv) -internal rate of return (irr) -net present value(npv) -payback period -strategic position -strategic choices -information technology -project management -finance -human resource management auditing: -internal audit -external audit -substantive procedures -analytic procedures -designing and assessment of internal controls -developing the flow charts & data flow diagrams -audit reports -engagement letter -materiality economics: -micro -macro -game theory -econometric -mathematical application in economics -empirical macroeconomics -international trade -international political economy -monetary theory and policy -public economics ,business law, and all regarding commerce
1+ Reviews
10+ Question Solved
Related Book For 
Question Posted:
