

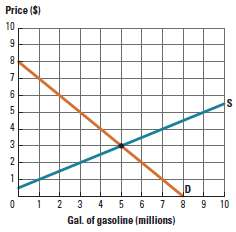
Figure 20P-1 shows a hypothetical market for gasoline. a. Suppose an excise tax of $1.50 per gallon
Question:
a. Suppose an excise tax of $1.50 per gallon is levied on gasoline suppliers. Draw the after-tax supply curve. What price will consumers pay? What price will sellers receive?
b. How much government revenue will result from the tax?
c. Suppose the tax is raised to $3 per gallon. Draw the new after-tax supply curve. How much additional revenue will this raise compared to the $1.50 tax?
d. Suppose the tax is raised again to $4.50 per gallon. Draw the new after-tax supply curve. Does this newest tax increase cause tax revenue to increase, decrease, or remain the same as compared to the $3 per gallon tax?
Figure 20P-1:
Fantastic news! We've Found the answer you've been seeking!
Step by Step Answer:
a An excise tax of 150 per gallon can be represented with a new supply curve located 150 a...View the full answer

Answered By
Pharashram rai
i am highly creative, resourceful and dedicated freelancer an excellent record of successful classroom presentations and writing . I have more than 4 years experience in tutoring students especially by using my note making strategies and engineering field . Especially adept at teaching methods of maths and writing , and flexible teaching style with the willingness to work beyond the call of duty. Committed to ongoing professional development and spreading the knowledge within myself to the blooming ones to make them fly with .
65+ Reviews
270+ Question Solved
Related Book For 
Question Posted:
