

Suppose you run a business that specializes in producing graphic T-shirts, using labor as an input. Based
Question:
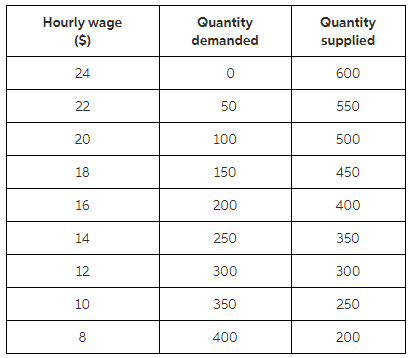
Table 16P-2:
Fantastic news! We've Found the answer you've been seeking!
Step by Step Answer:
The equilibrium occurs where supply and ...View the full answer

Answered By
Nazrin Ziad
I am a post graduate in Zoology with specialization in Entomology.I also have a Bachelor degree in Education.I posess more than 10 years of teaching as well as tutoring experience.I have done a project on histopathological analysis on alcohol treated liver of Albino Mice.
I can deal with every field under Biology from basic to advanced level.I can also guide you for your project works related to biological subjects other than tutoring.You can also seek my help for cracking competitive exams with biology as one of the subjects.
2+ Reviews
10+ Question Solved
Related Book For 

Question Posted:
