

The diagram below shows the demand curve facing a single-price monopolist. The firm is currently at point
Question:
The diagram below shows the demand curve facing a single-price monopolist. The firm is currently at point A on the demand curve, selling 20 units of output at a price of $160 per unit.
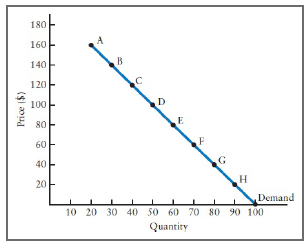
a. Calculate TR at each point along the demand curve, through H.
b. Suppose the firm reduces the price from $160 to $140. Calculate the revenue it will give up on the units it was already selling. Calculate the revenue it will gain on the new units it will sell. What is the firm?s marginal revenue by moving from point A to point B?
c. Calculate the marginal revenue for each increment of 10 additional units the firm sells, from B to C, C to D, and so on. Plot the MR curve on the diagram.
d. Explain in words why the MR curve facing a single-price monopolist is different than the MR curve facing a perfectly competitive firm.
Step by Step Answer:
See the figure below a The total revenue TR price x quantity is shown in the table below Point Price ...View the full answer


