

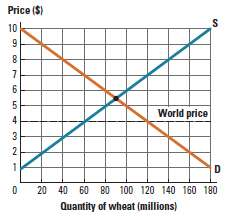
The United States wheat market is shown in Figure 17P-5. Suppose the United States wants to protect
Question:
a. Graph consumer and producer surplus after the $1/bushel tariff is imposed.
b. How much revenue does the U.S. government collect from the tariff?
c. Graph the deadweight loss associated with the tariff below the equilibrium quantity. Then graph the deadweight loss associated with the tariff above the equilibrium quantity.
Figure 17P-5:
Fantastic news! We've Found the answer you've been seeking!
Step by Step Answer:
a and c See the areas for consumer surplus CS and producer surplus PS ...View the full answer

Answered By
RADHIKA MEENAKAR
I am a qualified indian Company Secretary along with Masters in finance with over 6 plus years of professional experience. Apart from this i am a certified accounts and finance tutor on many online platforms.
My Linkedin profile link is here https://www.linkedin.com/in/radhika-meenakar-88b9808a/
12+ Reviews
22+ Question Solved
Related Book For 

Question Posted:
