

Question: Use the curve labeled Demand in Figure AP-1 to create a table (schedule) that shows Price in one column and Quantity in another. What is
Use the curve labeled €œDemand€ in Figure AP-1 to create a table (schedule) that shows Price in one column and Quantity in another. What is the slope of the curve labeled €œDemand€?
Figure AP-1:
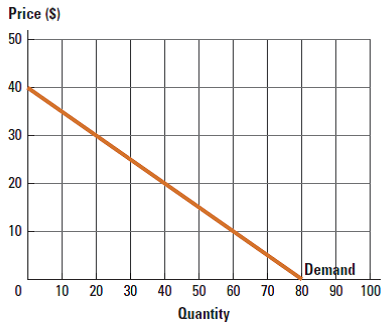
Price (S) 50 40 30 10 Demand 10 20 30 40 50 60 70 80 90 100 Quantity 20
Step by Step Solution
★★★★★
3.50 Rating (170 Votes )
There are 3 Steps involved in it
1 Expert Approved Answer
Step: 1 Unlock

Price Quantity Demanded 70 0 50 10 30 20 10 30 0 ... View full answer
Question Has Been Solved by an Expert!
Get step-by-step solutions from verified subject matter experts
Step: 2 Unlock
Step: 3 Unlock