

Use the graph in Figure DP-1 to answer the following questions. Figure DP-1: a. What is the
Question:
Figure DP-1:
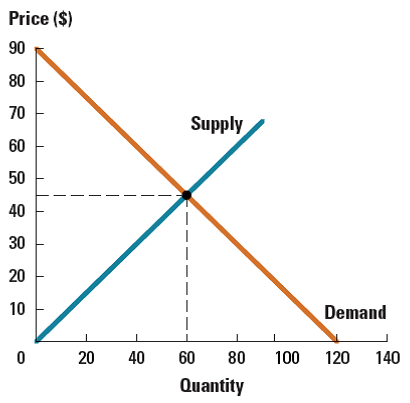
a. What is the amount of consumer surplus?
b. What is the amount of producer surplus?
c. What is the amount of total surplus?
Fantastic news! We've Found the answer you've been seeking!
Step by Step Answer:
a Consumer surplus is found by taking the area of the triangle above the market price and below ...View the full answer

Answered By
Arshad Ahmad
Well, I am really new to tutoring but I truly believe a good student can be a better teacher. I have always been a topper at school. I passed my Chartered Accountancy at a very young age of 23, a rare feat for most of the students. I am really dedicated to whatever work I do and I am very strict regarding deadlines. i am always committed and dedicated to whatever work allotted to me and I make sure it is completed well within deadline and also I try to give my best in whatever I do. Hope we will have a good time studying together.
1+ Reviews
10+ Question Solved
Related Book For 

Question Posted:
