

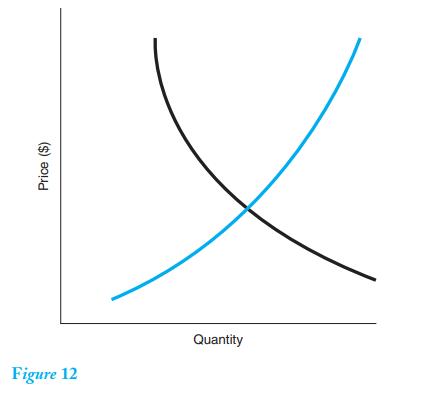
(a) Using Figure 12, draw a new demand curve, D 2 , which illustrates a decrease in...
Question:
(a) Using Figure 12, draw a new demand curve, D2 , which illustrates a decrease in demand. (b) State what happens to equilibrium price and quantity.
Step by Step Answer:

This question has not been answered yet.
You can Ask your question!
Related Book For 

Question Posted:
