

Draw in a new demand curve, D 1 , on Figure 4, showing an increase in demand.
Question:
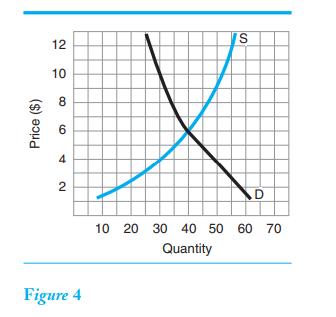
Draw in a new demand curve, D1 , on Figure 4, showing an increase in demand. What happens to equilibrium price and quantity?
Step by Step Answer:

This question has not been answered yet.
You can Ask your question!
Related Book For 

Question Posted:
