

Question: Plot the data listed in the table below. a. Use price as the vertical axis and quantity as the horizontal axis and plot the first
Plot the data listed in the table below.
a. Use price as the vertical axis and quantity as the horizontal axis and plot the first two columns.
b. Show what quantity is sold when the price is $550.
c. Directly below the graph in part a, plot the data in columns 2 and 3. Use total revenue as the vertical axis and quantity as the horizontal axis.
d. What is total revenue when the price is $550? Will total revenue increase or decrease when the price is lowered?
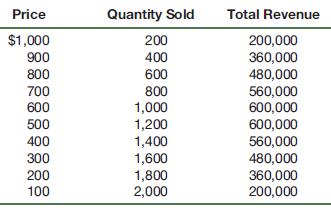
Price Quantity Sold Total Revenue $1,000 200 200,000 900 400 360,000 800 600 480,000 700 800 560,000 600 1,000 600,000 500 1,200 600,000 400 1,400 560,000 300 1,600 480,000 200 1,800 360,000 100 2,000 200,000
Step by Step Solution
3.38 Rating (167 Votes )
There are 3 Steps involved in it

Get step-by-step solutions from verified subject matter experts