

The graph that follows shows an individual firm in long-run equilibrium. In which market structure is this
Question:
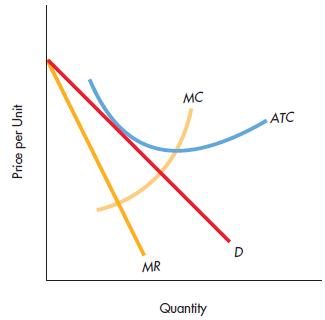
The graph that follows shows an individual firm in long-run equilibrium. In which market structure is this firm operating? Explain. Compare the long-run quantity and price to those of a perfectly competitive firm. What accounts for the difference? Is the equilibrium price greater than, equal to, or less than marginal cost? Why or why not?
Step by Step Answer:

This question has not been answered yet.
You can Ask your question!
Related Book For 
Question Posted:
