

Question: There is a decrease in demand of 1,000 units at each price and a decrease in supply of 1,000 units at each price. In Figure
There is a decrease in demand of 1,000 units at each price and a decrease in supply of 1,000 units at each price. In Figure 18, draw the new demand and supply curves and fi nd the new equilibrium price and quantity.
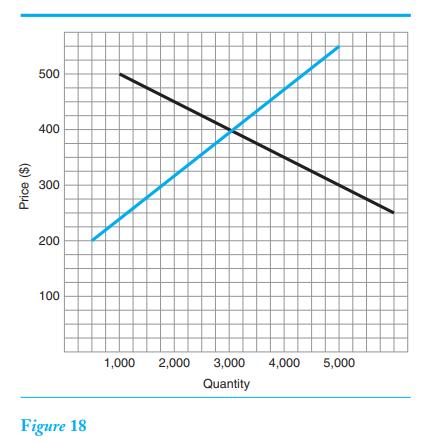
Price ($) 500 400 300 200 100 Figure 18 1,000 2,000 3,000 Quantity 4,000 5,000
Step by Step Solution
★★★★★
3.42 Rating (146 Votes )
There are 3 Steps involved in it
1 Expert Approved Answer
Step: 1 Unlock

Question Has Been Solved by an Expert!
Get step-by-step solutions from verified subject matter experts
Step: 2 Unlock
Step: 3 Unlock