

Question: Use the information in exercises 1 and 2 to graphically show maximum profit. Label the profit maximizing quantity and price, total cost, total revenue, and
Use the information in exercises 1 and 2 to graphically show maximum profit. Label the profit maximizing quantity and price, total cost, total revenue, and profit.
Data from in exercise 1
Use the following to calculate profit at each quantity of output.
Data from in exercise 2
Use the table in exercise 1 to calculate marginal revenue and marginal cost.
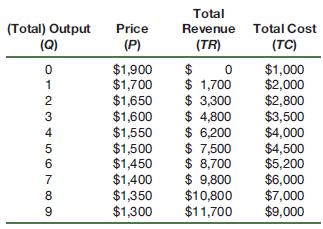
(Total) Output Price Total Revenue Total Cost (Q) (P) (TR) (TC) 0123456 $1,900 $ 0 $1,000 $1,700 $ 1,700 $2,000 $1,650 $ 3,300 $2,800 $1,600 $ 4,800 $3,500 $1,550 $ 6,200 $4,000 $1,500 $ 7,500 $4,500 $1,450 $ 8,700 $5,200 7 $1,400 $ 9,800 $6,000 88 $1,350 $10,800 $7,000 9 $1,300 $11,700 $9,000
Step by Step Solution
3.47 Rating (150 Votes )
There are 3 Steps involved in it
Step 1 Given Data Output Q Price P Total Revenue TR Total Cost TC 0 1900 0 1000 1 1700 1700 1600 2 1... View full answer

Get step-by-step solutions from verified subject matter experts