

Figure 68-4 shows the number of people in different demographic groups who watched various TV shows and
Question:
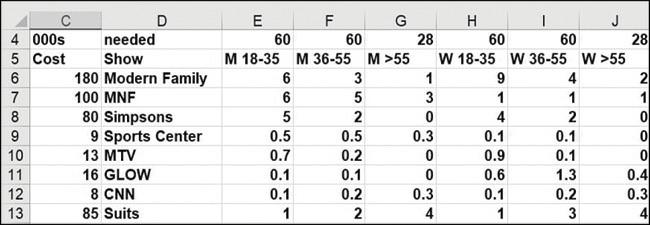
Figure 68-4 shows the number of people in different demographic groups who watched various TV shows and the cost (in thousands of dollars) of placing a 30-second ad on each show. For example, it cost $160,000 to place a 30-second ad on Modern Family (see figure). The show was watched by 6 million males between the ages 18 and 35, 3 million males between 36 and 55, 1 million males over 55, 9 million females between 18 and 35, 4 million females between 36 and 55, and 2 million females over 55. The data also includes the number of people in each group (in millions) to whom you would want to show the ad. For example, the advertiser wanted at least 60 million 18-to-35-year-old males to see its ads. What would be the cheapest way to meet these goals?
Step by Step Answer:
To determine the cheapest way to meet the goals we need to calculate the cost per person reached for ...View the full answer


Microsoft Excel Data Analysis And Business Modeling
ISBN: 9780137613663
7th Edition
Authors: Wayne Winston
