

Question: The file Customers.xlsx computes ending year-10 customers based on three inputs: starting customers, annual number of new customers, and churn rate. Create a spider plot
The file Customers.xlsx computes ending year-10 customers based on three inputs: starting customers, annual number of new customers, and churn rate. Create a spider plot that shows how ending year-10 customers varies as each input varies up to 40 percent from its base level.
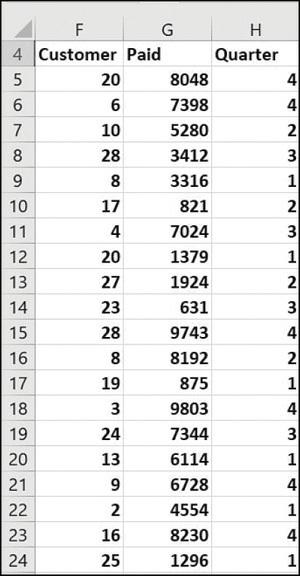
F 4 Customer Paid 5 6 7 8 9 10 11 12 13 14 15 16 17 18 19 199 20 21 22 23 24 20 6 10 28 8 17 4 20 27 23 28 8 19 3 24 13 9 2 16 25 G 8048 7398 5280 3412 3316 821 7024 1379 1924 631 9743 8192 875 9803 7344 6114 6728 4554 8230 1296 H Quarter 4 4 2 3 1 2 3 1 2 3 st 4 2 1 4 3 1 4 1 st 4 1
Step by Step Solution
3.43 Rating (156 Votes )
There are 3 Steps involved in it
Step 1 Load the Data Step 2 Calculate Var... View full answer

Get step-by-step solutions from verified subject matter experts