

Question: 15. In the budgeted profit/volume chart below, EG represents a two-product companys profit path. EH and HG represent the profit paths of products #1 and
15. In the budgeted profit/volume chart below, EG represents a two-product company’s profit path. EH and HG represent the profit paths of products #1 and #2, respectively.
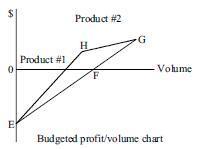 Sales prices and cost behavior were as budgeted, actual total sales equaled budgeted sales, and there were no inventories. Actual profit was greater than budgeted profit. Which product had actual sales in excess of budget, and what margin does OE divided by OF represent?
Product with excess sales OE/OF
a. #1 Contribution margin
b. #1 Gross margin
c. #2 Contribution margin
d. #2 Gross margin
E Product #2 H Product #1 F G Volume Budgeted profit/volume chart
Step by Step Solution
There are 3 Steps involved in it

Get step-by-step solutions from verified subject matter experts