

Question: 46. Using regression analysis, Fairfield Co. graphed the following relationship of its cheapest product lines sales with its customers income levels: If there is a
46. Using regression analysis, Fairfield Co. graphed the following relationship of its cheapest product line’s sales with its customers’ income levels:
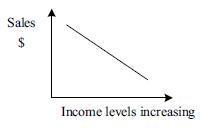 If there is a strong statistical relationship between the sales and customers’ income levels, which of the following numbers best represents the correlation coefficient for this relationship?
a. -9.00
b. -0.93
** CMA adapted
c. +0.93
d. +9.00
Sales $ Income levels increasing
Step by Step Solution
There are 3 Steps involved in it
1 Expert Approved Answer
Step: 1 Unlock

Question Has Been Solved by an Expert!
Get step-by-step solutions from verified subject matter experts
Step: 2 Unlock
Step: 3 Unlock