

Question: On the graph below, lines A-B-C and D-E-F illustrates residual income (measured on the vertical axis in dollars) at various interest rates. Point G is
On the graph below, lines A-B-C and D-E-F illustrates residual income (measured on the vertical axis in dollars) at various interest rates. Point G is the firm’s cost of capital.
Line ABC represents the residual income of Division X at various interest rates. Line DEF represents the residual income of Division Y at various interest rates.
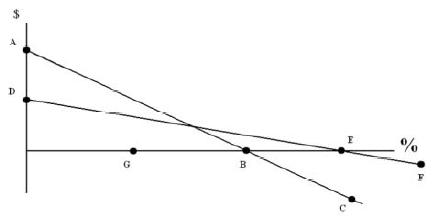
Based on the graph above, for Division X versus Division Y, is the residual income and ROI for Division X greater than or less than that of Division Y?
Residual income of Division X is greater than the residual income for Division Y Return on investment of Division X is greater than the ROI for Division Y
a. Yes Yes
b. Yes No
c. No Yes
d. No No
D G B %
Step by Step Solution
There are 3 Steps involved in it

Get step-by-step solutions from verified subject matter experts