

Question: 11. Consider the Bode plot in Figure 8.55. Phase (deg) Magnitude (dB) -50 -100 -150 -90 -135 -180 -225 -270 10-2 100 50 50 0
11. Consider the Bode plot in Figure 8.55.
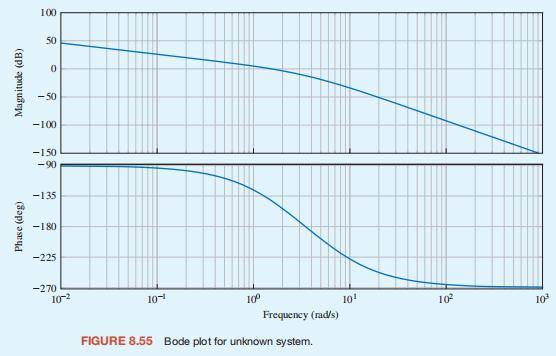
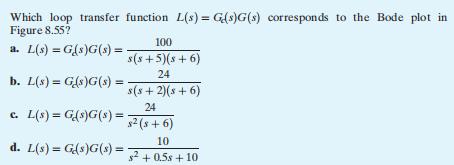
Phase (deg) Magnitude (dB) -50 -100 -150 -90 -135 -180 -225 -270 10-2 100 50 50 0 10-1 10 10 10 103 Frequency (rad/s) FIGURE 8.55 Bode plot for unknown system.
Step by Step Solution
There are 3 Steps involved in it
1 Expert Approved Answer
Step: 1 Unlock

Question Has Been Solved by an Expert!
Get step-by-step solutions from verified subject matter experts
Step: 2 Unlock
Step: 3 Unlock