

Question: 15. The transfer function corresponding to the Bode plot in Figure 8.56 is: Phase (deg) Magnitude (dB) 20 0 -20 -40 -60 0 -45 -90
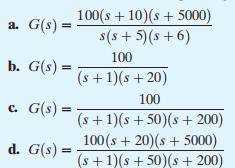
15. The transfer function corresponding to the Bode plot in Figure 8.56 is:
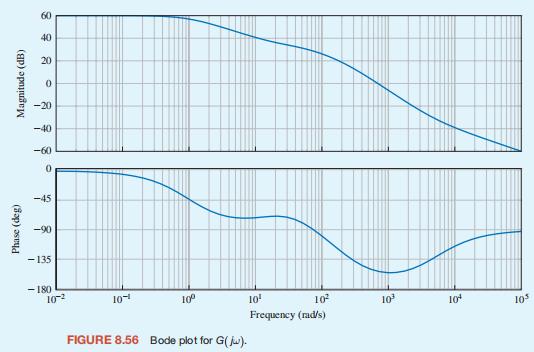
Phase (deg) Magnitude (dB) 20 0 -20 -40 -60 0 -45 -90 -135
Step by Step Solution
There are 3 Steps involved in it
1 Expert Approved Answer
Step: 1 Unlock

Question Has Been Solved by an Expert!
Get step-by-step solutions from verified subject matter experts
Step: 2 Unlock
Step: 3 Unlock