

Question: AP5.3 A closed-loop system is shown in Figure AP5.3. Plot the response to a unit step input for the system with p = 0,
AP5.3 A closed-loop system is shown in Figure AP5.3.
Plot the response to a unit step input for the system with τp = 0, 0.2, 1, and 4. Record the percent over
shoot, rise time, and settling time (with a 2% crite
rion) as τp varies. Describe the effect of varying τp.
Compare the location of the open-loop pole − /1 τp
with the location of the closed-loop poles.
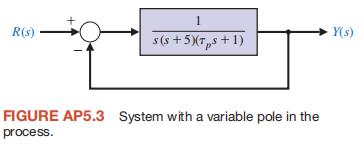
1 R(s) Y(s) s(s+5)(Tps+1) FIGURE AP5.3 System with a variable pole in the process.
Step by Step Solution
There are 3 Steps involved in it
1 Expert Approved Answer
Step: 1 Unlock

Question Has Been Solved by an Expert!
Get step-by-step solutions from verified subject matter experts
Step: 2 Unlock
Step: 3 Unlock