

Question: CP8.5 A block plot of a second-order system is shown in Figure CP8.5. (a) Determine the resonant peak M p the res onant frequency
CP8.5 A block plot of a second-order system is shown in Figure CP8.5. 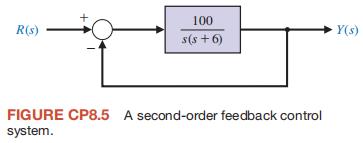
(a) Determine the resonant peak Mpω the res
onant frequency ωr, and the bandwidth ωB, of the system from the closed-loop Bode plot. Generate the Bode plot with an m-file for ω = 0.1 to ω = 1,000 rad s using the logspace function.
(b) Estimate the system damping ratio, ζ, and natural frequency ω.
(c) From the closed-loop transfer function, compute the actual ζ and ωn and compare with your results in part (b).
100 R(s) Y(s) s(s+6) FIGURE CP8.5 A second-order feedback control system.
Step by Step Solution
There are 3 Steps involved in it
1 Expert Approved Answer
Step: 1 Unlock

Question Has Been Solved by an Expert!
Get step-by-step solutions from verified subject matter experts
Step: 2 Unlock
Step: 3 Unlock