

Question: E8.10 The dynamic analyzer shown in Figure E8.10(a) can be used to display the frequency response of a system. Figure E8.10 (b) shows the actual
E8.10 The dynamic analyzer shown in Figure E8.10(a)
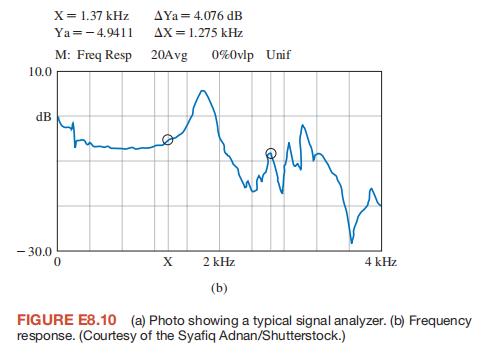
can be used to display the frequency response of a system. Figure E8.10
(b) shows the actual frequency response of a system. Estimate the poles and zeros of the device. Note X = 1.37 kHz at the first cursor, and
∆ = X 1.257 kHz to the second cursor.
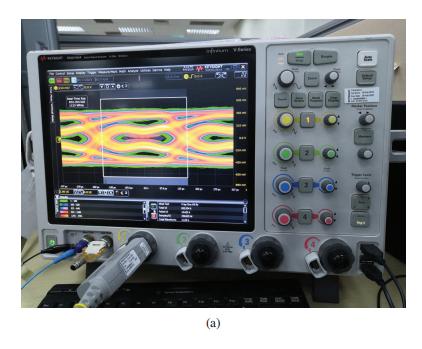
KOL (a)
Step by Step Solution
There are 3 Steps involved in it
1 Expert Approved Answer
Step: 1 Unlock

Question Has Been Solved by an Expert!
Get step-by-step solutions from verified subject matter experts
Step: 2 Unlock
Step: 3 Unlock