

In a study reported in the article Can Low-Fat Nutrition Labels Lead to Obesity? (J. Market. Res.
Question:
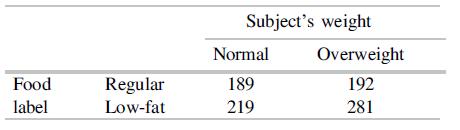
In a study reported in the article “Can ‘Low-Fat’ Nutrition Labels Lead to Obesity?” (J. Market. Res. 2006: 605–617), students and parents attending a university open house were offered one of two candy bowls: one labeled “New Colors of Regular M&M’s” or another labeled “New ‘Low- Fat’ M&M’s.” (The latter product does not really exist; the candies were just regular M&M’s.) The researchers asked each person to fill out a questionnaire (including height and weight information) and recorded how much candy s/he took. The two factors of interest are A = how the candy was labeled (regular, low-fat) and B = the person’s weight status (defined as “normal weight” for a body mass index below 25, “overweight” otherwise). The response variable used for the analysis was the amount of calories in the M&M’s taken by the subject.
a. The accompanying table shows the average calorie consumption for each “treatment.” Construct an interaction plot, and describe what you discover.
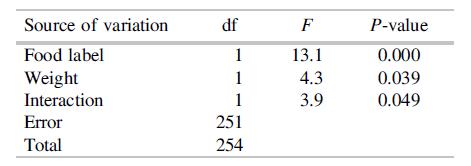
b. The article includes the following F-values and P-values for the various effects (error and total df do not follow our formulas because the study design was not balanced, but this does not affect the interpretation of the results). Are the results of the F tests consistent with the interaction plot? Explain.
Step by Step Answer:
a To construct an interaction plot you would graph the average calorie consumptions for each combination of the two factors food label regular lowfat ...View the full answer


Modern Mathematical Statistics With Applications
ISBN: 9783030551551
3rd Edition
Authors: Jay L. Devore, Kenneth N. Berk, Matthew A. Carlton
