

Question: The accompanying normal probability plot was constructed from a sample of 30 readings on tension for mesh screens behind the surface of video display tubes.
The accompanying normal probability plot was constructed from a sample of 30 readings on tension for mesh screens behind the surface of video display tubes. Does it appear plausible that the tension distribution is normal? Explain.
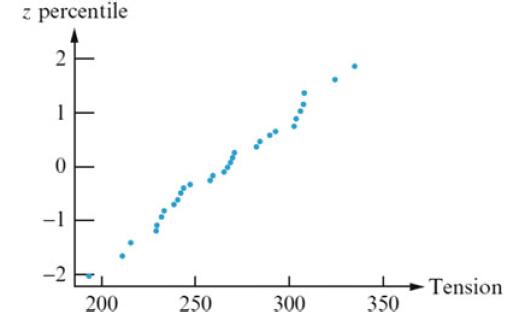
z percentile 0 -2 200 ***** 250 ..... 300 350 Tension
Step by Step Solution
★★★★★
3.46 Rating (166 Votes )
There are 3 Steps involved in it
1 Expert Approved Answer
Step: 1 Unlock

The normal probability plot is a graphical tool used to assess whether a dataset follows a normal di... View full answer
Question Has Been Solved by an Expert!
Get step-by-step solutions from verified subject matter experts
Step: 2 Unlock
Step: 3 Unlock