

Question: The article Developing Coal Pillar Stability Chart Using Logistic Regression (J. Rock Mech. Mining Sci. 2013: 5560) includes the following data on x 1 =
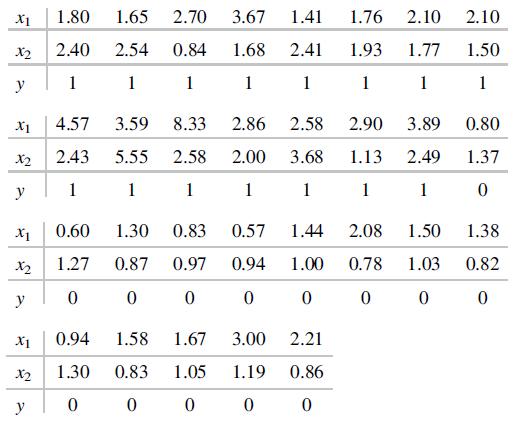
The article “Developing Coal Pillar Stability Chart Using Logistic Regression” (J. Rock Mech. Mining Sci. 2013: 55–60) includes the following data on x1 = height– width ratio, x2 = strength–stress ratio, and y = 1 (stable) or 0 (not stable) for 29 pillars used to stabilize current and former mines in India.
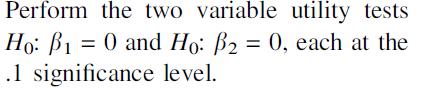
a. Fit a multiple logistic regression model to this data, and report the estimated logit equation.
b.
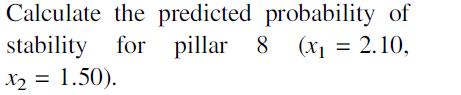
c.
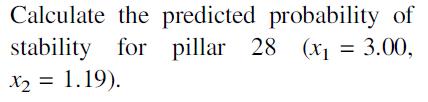
d.
X1 X2 y X1 X2 y X1 X2 y X1 X2 y 1.80 1.65 2.70 3.67 1.41 1.76 2.40 2.54 0.84 1.68 2.41 1.93 1 1 1 1 1 4.57 3.59 2.43 5.55 1 1 0.60 1.27 0 0.94 1.30 0 1.30 0.87 0 1.58 0.83 0 8.33 2.86 2.58 2.90 3.89 0.80 2.58 2.00 3.68 1.13 2.49 1.37 1 1 1 1 1 0 0.83 0.97 0 1.67 1.05 0 0.57 0.94 0 3.00 1.19 0 2.10 2.10 1.77 1.50 1 1 1 1.44 2.08 1.50 1.38 1.00 0.78 1.03 0.82 0 0 0 0 2.21 0.86 0
Step by Step Solution
3.40 Rating (159 Votes )
There are 3 Steps involved in it
To address the various aspects of this problem well need to perform a multiple logistic regression analysis using the given data Since executing stati... View full answer

Get step-by-step solutions from verified subject matter experts