

Consider the graph shown in Figure 14.14. Data from Figure 14. 14 a. What is being illustrated
Question:
Consider the graph shown in Figure 14.14.
Data from Figure 14.14
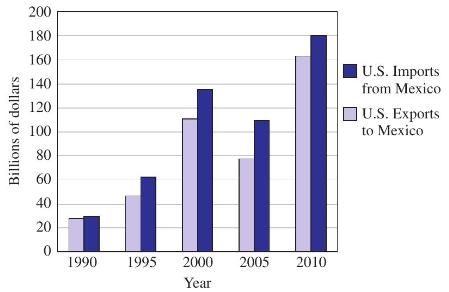
a. What is being illustrated in this graph?
b. Did the United States have more imports or exports for the years 1990-2010?
Step by Step Answer:

This question has not been answered yet.
You can Ask your question!
Related Book For 

Question Posted:
