

Find the best-fitting line for the data in Problem 50. Data from problem 50 The following data
Question:
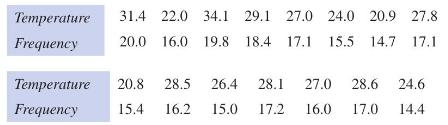
Find the best-fitting line for the data in Problem 50.
Data from problem 50
The following data are measurements of temperature \(\left(x={ }^{\circ} \mathrm{F}ight)\) and chirping frequency \((y=\) chirps per second \()\) for the striped ground cricket.
Is there a correlation between temperature and chirping, and if so is it significant at the \(5 \%\) or the \(1 \%\) significance level?
Fantastic news! We've Found the answer you've been seeking!
Step by Step Answer:

Answered By
Carly Cimino
As a tutor, my focus is to help communicate and break down difficult concepts in a way that allows students greater accessibility and comprehension to their course material. I love helping others develop a sense of personal confidence and curiosity, and I'm looking forward to the chance to interact and work with you professionally and better your academic grades.
12+ Reviews
21+ Question Solved
Related Book For 

Question Posted:
