

The graph in Figure 18.20 shows company output as a function of the number of workers. In
Question:
The graph in Figure 18.20 shows company output as a function of the number of workers. In Problems 9-12, find the average rate of change of output for the given change in the number of workers.
Figure 18.20
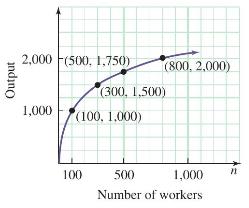
100 to 500
Step by Step Answer:

This question has not been answered yet.
You can Ask your question!
Related Book For 

Question Posted:
