

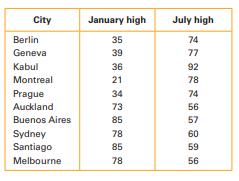
Question: grouped Temperature Data. The following table shows the average January high temperature and the average July high temperature for 10 major cities around the world.
grouped Temperature Data. The following table shows the average January high temperature and the average July high temperature for 10 major cities around the world.
a. Construct a scatterplot for the data. Estimate or compute the correlation coefficient. Based on this correlation coefficient, would you conclude that January and July temperatures are correlated for these cities?
Explain.
b. Notice that the first five cities in the table are in the Northern Hemisphere and the next five are in the Southern Hemisphere. How does this change your view of the correlation? Would you now conclude that January and July temperatures are correlated for these cities? Explain.
City January high July high Berlin 35 74 Geneva 39 77 Kabul 36 92 Montreal 21 78 Prague 34 74 Auckland 73 56 Buenos Aires 85 57 Sydney 78 60 Santiago 85 59 Melbourne 78 56
Step by Step Solution
There are 3 Steps involved in it

Get step-by-step solutions from verified subject matter experts