

Question: Pulse rates. Figure 9 shows a histogram for the pulse rates of 98 students. The mean pulse rate is 71.2 beats per minute. Is this
Pulse rates. Figure 9 shows a histogram for the pulse rates of 98 students. The mean pulse rate is 71.2 beats per minute. Is this distribution close to normal? Should this variable have a normal distribution? Why or why not?
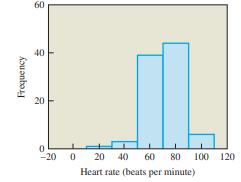
20 Frequency 20 40 60 0 -20 0 20 40 60 80 100 120 Heart rate (beats per minute)
Step by Step Solution
There are 3 Steps involved in it
1 Expert Approved Answer
Step: 1 Unlock

Question Has Been Solved by an Expert!
Get step-by-step solutions from verified subject matter experts
Step: 2 Unlock
Step: 3 Unlock