

Question: Time-series Graph for Cell Phone subscriptions. The following table shows the numbers of cell phone subscriptions (in thousands) in the United States for various years.
Time-series Graph for Cell Phone subscriptions. The following table shows the numbers of cell phone subscriptions (in thousands) in the United States for various years. Construct a time-series graph of the data. “Linear”
growth would result in a graph that is approximately a straight line. Does the time-series graph appear to show linear growth?
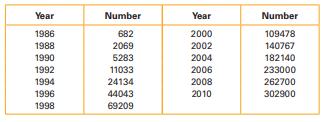
Year Number Year Number 1986 682 2000 109478 1988 2069 2002 140767 1990 5283 2004 182140 1992 11033 2006 233000 1994 24134 2008 262700 1996 44043 2010 302900 1998 69209
Step by Step Solution
There are 3 Steps involved in it
1 Expert Approved Answer
Step: 1 Unlock

Question Has Been Solved by an Expert!
Get step-by-step solutions from verified subject matter experts
Step: 2 Unlock
Step: 3 Unlock