

Question: The scatterplot and least squares summary below show the relationship between weight measured in kilograms and height measured in centimeters of 507 physically active individuals.
The scatterplot and least squares summary below show the relationship between weight measured in kilograms and height measured in centimeters of 507 physically active individuals.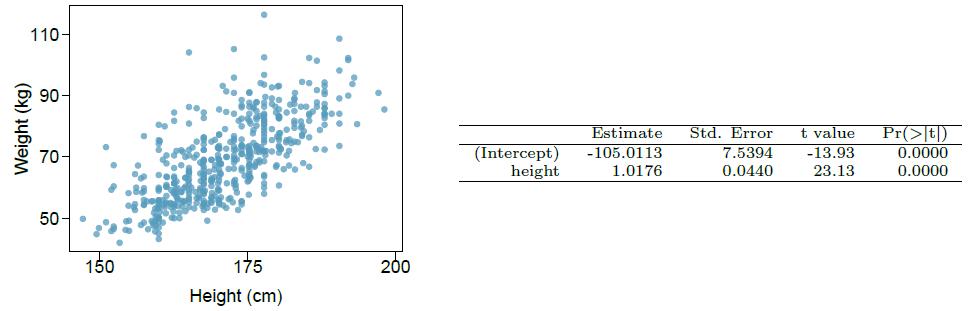
(a) Describe the relationship between height and weight.
(b) Write the equation of the regression line. Interpret the slope and intercept in context.
(c) Do the data provide strong evidence that an increase in height is associated with an increase in weight? State the null and alternative hypotheses, report the p value, and state your conclusion.
(d) The correlation coefficient for height and weight is 0.72. Calculate R2 and interpret it in context.
110- Weight (kg) 90- 70- 50- 150 175 Height (cm) 200 (Intercept) height Estimate Std. Error -105.0113 7.5394 1.0176 0.0440 t value -13.93 23.13 Pr(>t) 0.0000 0.0000
Step by Step Solution
3.49 Rating (166 Votes )
There are 3 Steps involved in it
a Describe the relationship between height and weight The scatterplot shows a positive relationship between height and weight which means that as heig... View full answer

Get step-by-step solutions from verified subject matter experts