

Question: The two scatterplots below show the relationship between final and mid-semester exam grades recorded during several years for a Statistics course at a university. (a)
The two scatterplots below show the relationship between final and mid-semester exam grades recorded during several years for a Statistics course at a university.
(a) Based on these graphs, which of the two exams has the strongest correlation with the final exam grade? Explain.
(b) Can you think of a reason why the correlation between the exam you chose in part (a) and the final exam is higher?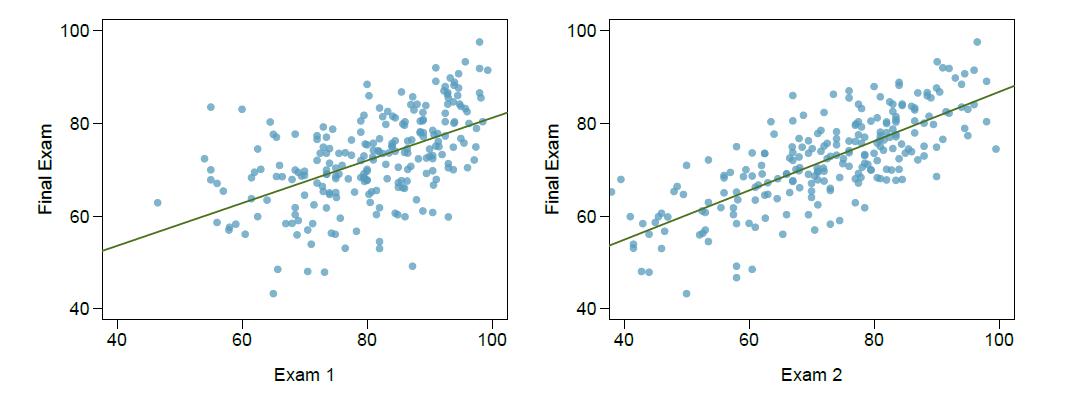
Final Exam 100 60- 40- 1 40 60 Exam 1 80 100 Final Exam 100- 80- 60- 40 40 60 Exam 2 80 100
Step by Step Solution
3.38 Rating (164 Votes )
There are 3 Steps involved in it
a To determine which of the two exams shows the strongest correlation with the final exam grade we need to look at how tightly the points in the scatt... View full answer

Get step-by-step solutions from verified subject matter experts