

Question: The visualization below shows voting patterns in the United States, Canada, and Mexico in the United Nations General Assembly on a variety of issues. Specifically,
The visualization below shows voting patterns in the United States, Canada, and Mexico in the United Nations General Assembly on a variety of issues. Specifically, for a given year between 1946 and 2015, it displays the percentage of roll calls in which the country voted yes for each issue. This visualization was constructed based on a dataset where each observation is a country / year pair.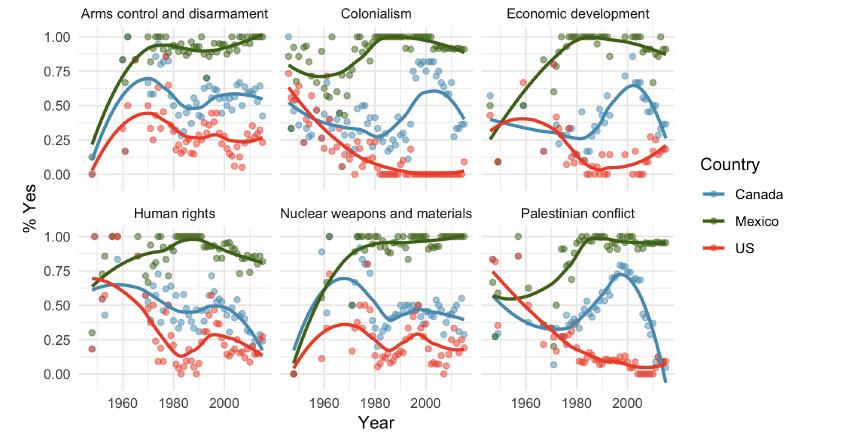
(a) List the variables used in creating this visualization.
(b) Indicate whether each variable in the study is numerical or categorical. If numerical, identify as continuous or discrete. If categorical, indicate if the variable is ordinal.
% Yes 1.00 0.75 0.50 0.25 0.00 1.00 0.75 0.50 0.25 0.00 Arms control and disarmament Human rights 00 1960 1980 2000 Colonialism Nuclear weapons and materials OP 1960 1980 2000 Year 00 Economic development Palestinian conflict 1960 1980 2000 Country Canada Mexico US
Step by Step Solution
3.43 Rating (150 Votes )
There are 3 Steps involved in it
Solutions Step 1 Visualization is given about the voting patterns in the united states canada and me... View full answer

Get step-by-step solutions from verified subject matter experts