

Perform an ABC analysis for the data provided in worksheet C11P4 in the OM5 Data Workbook .
Question:
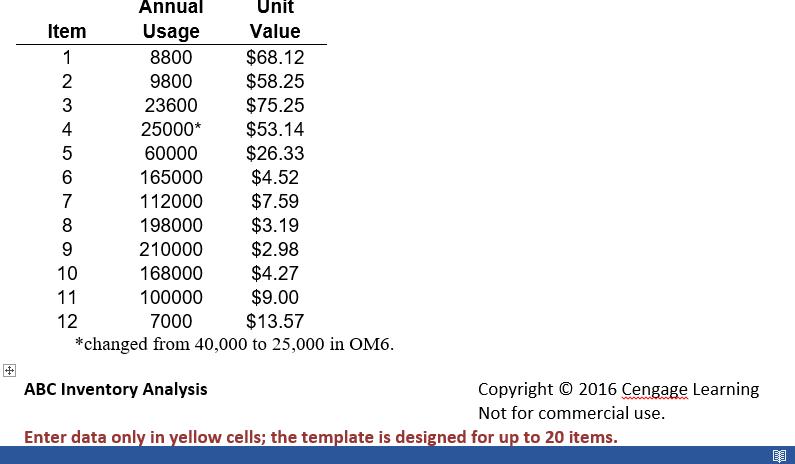
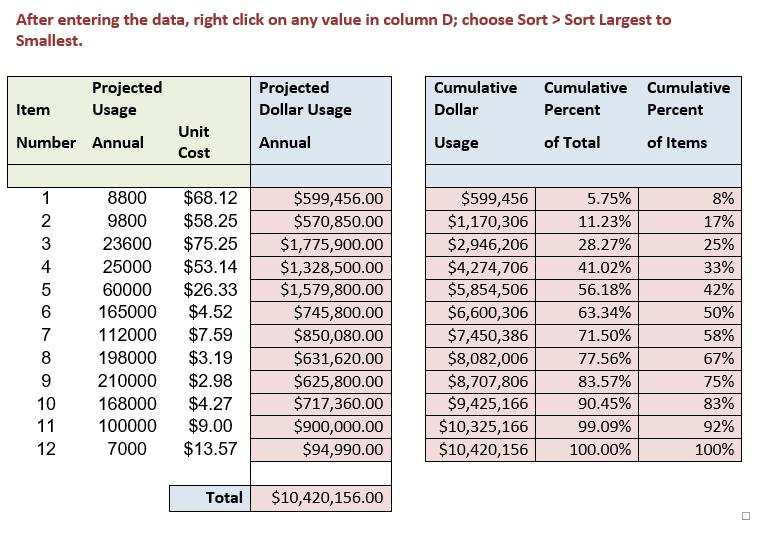
Perform an ABC analysis for the data provided in worksheet C11P4 in the OM5 Data Workbook. Clearly explain why you classified items as A, B, or C. The data set is as follows (in OM6 Data Workbook)
Data From OM5 Data Workbook:
| Optional Topic (Do not recommend covering except for advanced courses | |||||||
| and students but FYI; req'ds additional readings) | |||||||
| Safety Stock varies with the square root of the number of stocking points | |||||||
| for the same service level | |||||||
| EOQ | 62.00 | ||||||
| Safety Stock | 21.3 | ||||||
| Q/2 + SS | 52.32 | ||||||
| No. Stock Points | Gallons | $ Ave Inv | |||||
| 1 | 52 | $1,101 | |||||
| 2 | 74 | $1,558 | |||||
| 3 | 91 | $1,908 | |||||
| 4 | 105 | $2,203 | |||||
| 31 | 291 | $6,132 | |||||
| 50 | 370 | $7,788 | |||||
| 100 | 523 | $11,014 | |||||
| 150 | 641 | $13,489 | |||||
| 200 | 740 | $15,576 | |||||
| 231 | 795 | $16,740 | |||||
| Note: 231 is 215 secondary pts + 24 depts. + hospital storeroom + university storeroom | |||||||
| Conclusion: Additional stocking points are expensive! So try to reduce them with | |||||||
| moving carts of inventory, no stock in exam rooms, only one department store room, etc. | |||||||
Data From OM6 Data Workbook:
Fantastic news! We've Found the answer you've been seeking!
Step by Step Answer:

Answered By
Muhammad Umair
I have done job as Embedded System Engineer for just four months but after it i have decided to open my own lab and to work on projects that i can launch my own product in market. I work on different softwares like Proteus, Mikroc to program Embedded Systems. My basic work is on Embedded Systems. I have skills in Autocad, Proteus, C++, C programming and i love to share these skills to other to enhance my knowledge too.
1+ Reviews
10+ Question Solved
Related Book For 
OM6 operations supply chain management
ISBN: 978-1305664791
6th edition
Authors: David Alan Collier, James R. Evans
Question Posted:
