

The worksheet C16P12 in the OM6 Data Workbook provides 5 examples of control charts. Interpret the patterns
Question:
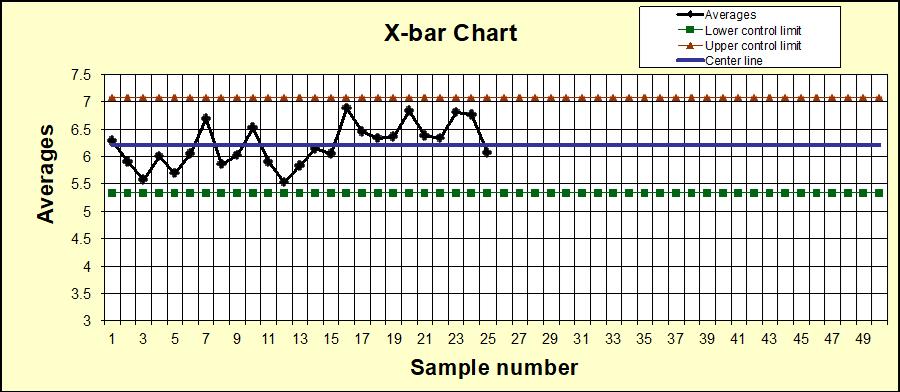
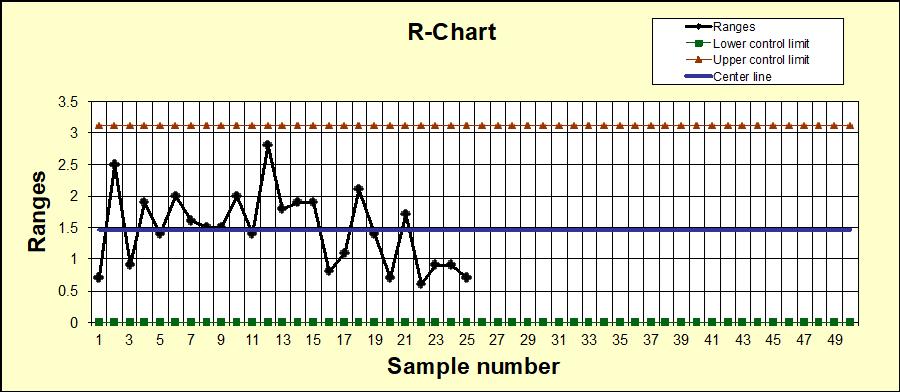
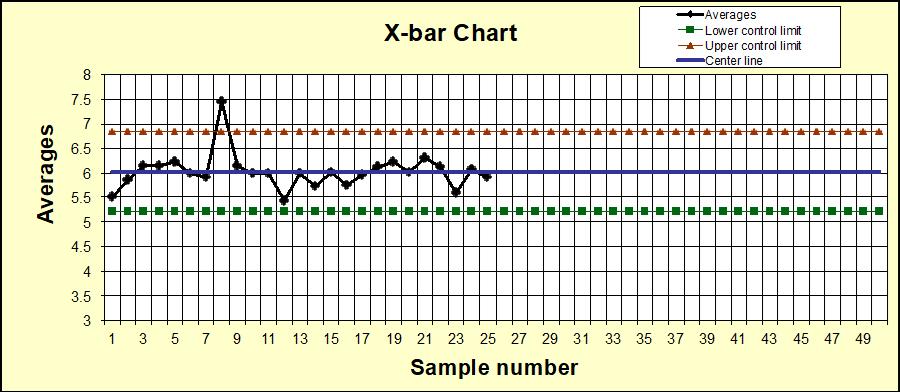
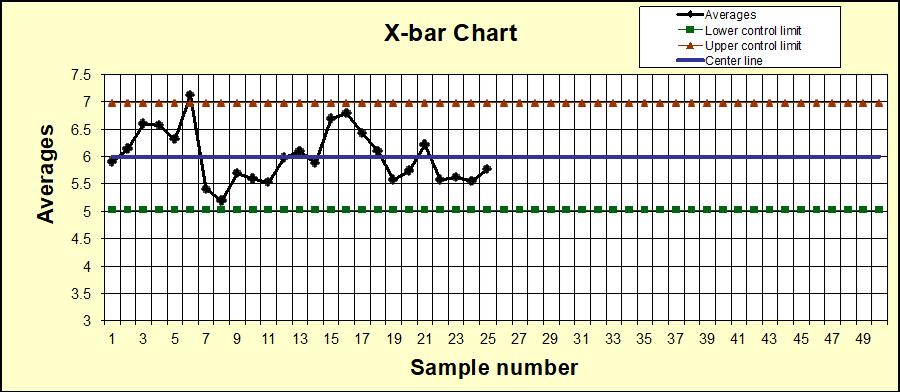
The worksheet C16P12 in the OM6 Data Workbook provides 5 examples of control charts. Interpret the patterns in each and determine if the processes are in control. If not, state the type of out-of-control condition that you identify (for example, points outside of the control limits, shifts, trends, and so on.)
![Averages 7.5 7 6.5 9 5.5 5 4.5 4 3.5 3 HT Th #7 Ki 12 +4 11 * +I 4 H #E K * 11 #I 11 CH CH Ki [] ++ 77 K ILJ](https://dsd5zvtm8ll6.cloudfront.net/si.question.images/images/question_images/1697/4/4/1/880652ce858e964e1697441879403.jpg)
Fantastic news! We've Found the answer you've been seeking!
Step by Step Answer:
The control charts provided are tools for understanding process variability and to determine if the process is in control We have three Xbar charts an...View the full answer

Answered By
Mugdha Sisodiya
My self Mugdha Sisodiya from Chhattisgarh India. I have completed my Bachelors degree in 2015 and My Master in Commerce degree in 2016. I am having expertise in Management, Cost and Finance Accounts. Further I have completed my Chartered Accountant and working as a Professional.
Since 2012 I am providing home tutions.
2+ Reviews
10+ Question Solved
Related Book For 

OM6 operations supply chain management
ISBN: 978-1305664791
6th edition
Authors: David Alan Collier, James R. Evans
Question Posted:
