

Question: 2. If graphics are available, plot the control limits and the X and R values from the samples. SAMPLE OBSERVED DIMENSIONS (CM) SAMPLE OBSERVED DIMENSIONS
2. If graphics are available, plot the control limits and the X and R values from the samples.
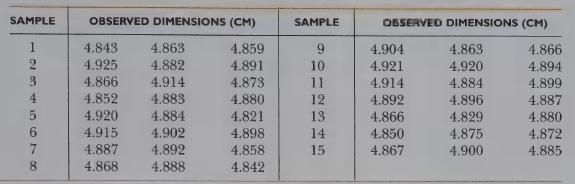
SAMPLE OBSERVED DIMENSIONS (CM) SAMPLE OBSERVED DIMENSIONS (CM) 4.843 4.863 4.859 4.904 4.863 4.866 4.925 4.882 4.891 10 4.921 4.920 4.894 4.866 4.914 4.873 11 4.914 4.884 4.899 4.852 4.883 4.880 12 4.892 4.896 4.887 4.920 4.884 4.821 13 4.866 4.829 4.880 4.915 4.902 4.898 14 4.850 4.875 4.872 4.887 4.892 4.858 15 4.867 4.900 4.885 4.868 4.888 4.842 12345678
Step by Step Solution
There are 3 Steps involved in it
1 Expert Approved Answer
Step: 1 Unlock

Question Has Been Solved by an Expert!
Get step-by-step solutions from verified subject matter experts
Step: 2 Unlock
Step: 3 Unlock