

Question: Calculate cÌ and the sample standard deviation for the C chart. Over a 10-day period, a manufacturing company has counted the number of units not
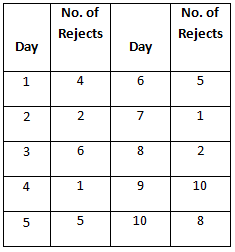
No. of No. of Rejects Rejects Day Day 5 10 4 10 2. 2. 6. 2.
Step by Step Solution
★★★★★
3.45 Rating (168 Votes )
There are 3 Steps involved in it
1 Expert Approved Answer
Step: 1 Unlock

c 44... View full answer
Question Has Been Solved by an Expert!
Get step-by-step solutions from verified subject matter experts
Step: 2 Unlock
Step: 3 Unlock
Document Format (2 attachments)
1454_6054778c4e216_668044.pdf
180 KBs PDF File
1454_6054778c4e216_668044.docx
120 KBs Word File