

Question: Consider the data in the following table and answer these questions: How would you estimate the passenger volume for the coming year? What is the
Consider the data in the following table and answer these questions:
How would you estimate the passenger volume for the coming year? What is the role of trends and seasonality? What other variables do you expect to influence the number of international travelers?
The U.S. Department of Transportation publishes the number of international passengers that come through U.S. airports. The busiest airports for international travel are in New York (JFK), Miami (MIA), Los Angeles (LAX), Newark (EWR), and Chicago (ORD). The most popular destinations are London (LHR), Toronto (YYZ), Tokyo (NR), Frankfurt (FRA), and Paris (CDG).
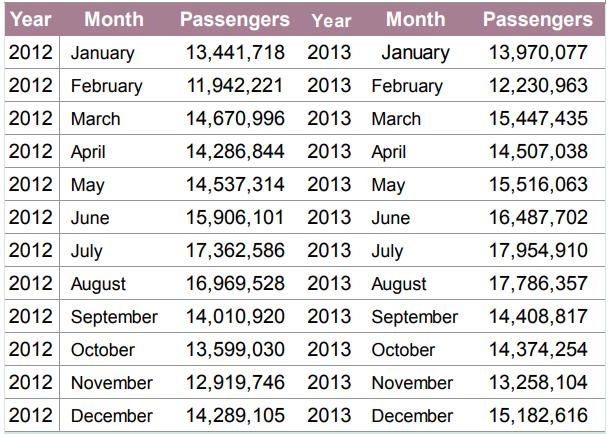
Year Month Passengers Year Month Passengers 2012 January 13,441,718 2013 January 13,970,077 2012 February 11,942,221 2013 February 12,230,963 2012 March 14,670,996 2013 March 15,447,435 2012 April 14,286,844 2013 April 14,507,038 2012 May 14,537,314 2013 May 15,516,063 2012 June 15,906,101 2013 June 16,487,702 2012 July 17,362,586 2013 July 17,954,910 2012 August 2012 September 2012 October 16,969,528 2013 August 17,786,357 14,010,920 2013 September 14,408,817 13,599,030 2013 October 14,374,254 2012 November 12,919,746 2013 November 13,258,104 2012 December 14,289,105 2013 December 15,182,616
Step by Step Solution
3.45 Rating (171 Votes )
There are 3 Steps involved in it
Two forces seem to be at work here An overall trend when comparing the 2013 months with the 2012 months the 2013 are all a little higher to be exact t... View full answer

Get step-by-step solutions from verified subject matter experts