

Question: Develop a linear trend line model for the first-year applications data at the university in Problem 12-32. a. Does this forecast appear to be more
a. Does this forecast appear to be more or less accurate than the linear regression forecast developed in Problem 12-32? Justify your answer.
b. Compute the correlation coefficient for the linear trend line forecast and explain its meaning.
Problem 12-32
The registrar at a local university believes that decreases in the number of first-year applications that have been experienced are directly related to tuition increases. They have collected the following enrollment and tuition data for the past decade:
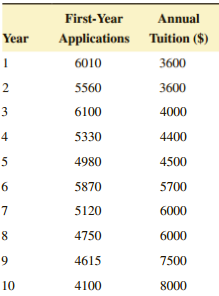
First-Year Annual Year Applications Tuition ($) 6010 3600 5560 3600 6100 4000 5330 4400 5 4980 4500 5870 5700 7 5120 6000 4750 6000 9. 4615 7500 4100 10 8000 3. 4)
Step by Step Solution
3.45 Rating (164 Votes )
There are 3 Steps involved in it
Linear Trend Year Application Line Forecast 1 6010 606972 ... View full answer

Get step-by-step solutions from verified subject matter experts