

Question: Monitor the adjusted exponential smoothing forecast in Problem 12.13 for bias using a tracking signal and a control chart with 3 MAD. Data in Problem
Monitor the adjusted exponential smoothing forecast in Problem 12.13 for bias using a tracking signal and a control chart with ±3 MAD.
Data in Problem 12.13
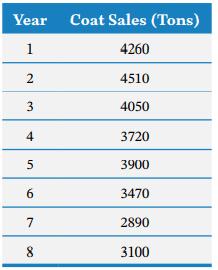
The Willow River Mining Company mines and ships coal. It has experienced the following demand for coal during the past eight years:
Develop an adjusted exponential smoothing model (α = .30, β = .20) and a linear trend line model, and compare the forecast accuracy of the two using MAD. Indicate which forecast seems to be most accurate.
Year Coat Sales (Tons) 1 4260 2 4510 3 4050 4 5 6 7 8 3720 3900 3470 2890 3100
Step by Step Solution
3.18 Rating (159 Votes )
There are 3 Steps involved in it
To monitor the adjusted exponential smoothing forecast for bias using a tracking signal and a control chart we would first need to calculate the forec... View full answer

Get step-by-step solutions from verified subject matter experts