

Revisit the example of how process mapping helped Intel to improve its expense claims process (Figure 4.16).
Question:
Revisit the example of how process mapping helped Intel to improve its expense claims process (Figure 4.16).
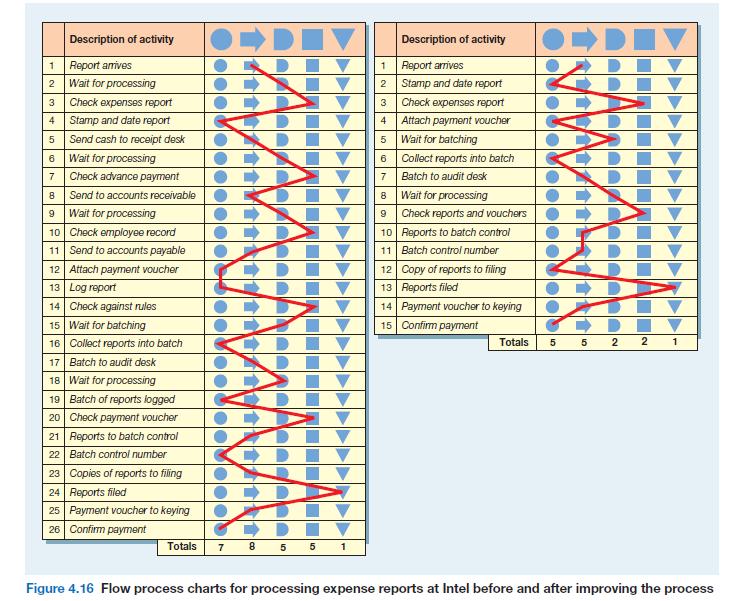 (a) This example describes how Intel used a flow process chart. What was the nature of the improvement it effected by doing this?
(b) Do you think it was necessary to draw this chart in order to make the improvement?
(c) What do you think are the limitations of using charts like this for improvement?
Step by Step Answer:

This question has not been answered yet.
You can Ask your question!
Related Book For 
Operations Management
ISBN: 9780273708476
5th Edition
Authors: Nigel Slack, Stuart Chambers, Robert Johnston
Question Posted:
