

The Trinity Hospital Quality Improvement (QI) team wants to monitor the C section deliveries of pregnant mothers
Question:
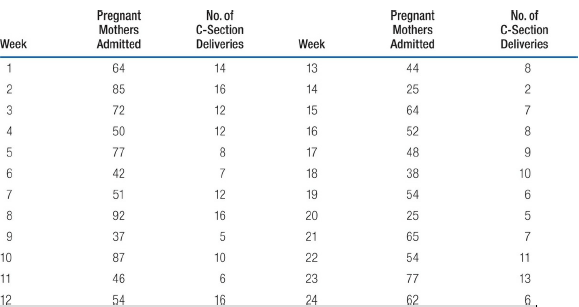
1. Why did the QI team decide to use a p-chart?
2. Construct a p-chart using the data given in the table.
3. Determine whether the process is in control, as the hospital is worried that too many C-sections are being performed to the detriment of patients?
Fantastic news! We've Found the answer you've been seeking!
Step by Step Answer:
12 A pchart is appropriate because the data are binomial and have a variable sample size Since the ...View the full answer

Answered By
Ann Wangechi
hey, there, paying attention to detail is one of my strong points, i do my very best combined with passion. i enjoy researching since the net is one of my favorite places to be and to learn. i am a proficient and versatile blog, article academic and research writing i possess excellent English writing skills, great proof-reading. i am a good communicator and always provide feedback in real time. i'm experienced in the writing field, competent in computing, essays, accounting and research work and also as a Database and Systems Administrator
151+ Reviews
291+ Question Solved
Related Book For 

Operations Management Managing Global Supply Chains
ISBN: 978-1506302935
1st edition
Authors: Ray R. Venkataraman, Jeffrey K. Pinto
Question Posted:
