

Question: This Active Model appears in myomlab. It allows you to see the effects of sample size and z-values on control charts. QUESTIONS 1. Has the
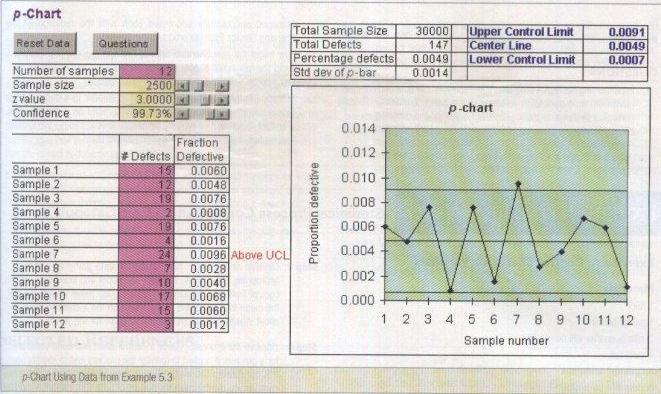
This Active Model appears in myomlab. It allows you to see the effects of sample size and z-values on control charts.
QUESTIONS
1. Has the booking process been in statistical control?
2. Suppose we use a 95 percent p-chart. How do the upper and lower control limits change? What are your conclusions about the booking process?
3. Suppose that the sample size is reduced to 2,000 instead. of 2,500. How does this affect the chart?
4. What happens to the chart as we reduce the z-value?
5. What happens to the chart as we reduce the confidence level?
Step by Step Solution
3.50 Rating (167 Votes )
There are 3 Steps involved in it
Yes A booking process is in statistical control when the output of the process is predictable and consistent and any variations in the output can be a... View full answer

Get step-by-step solutions from verified subject matter experts